

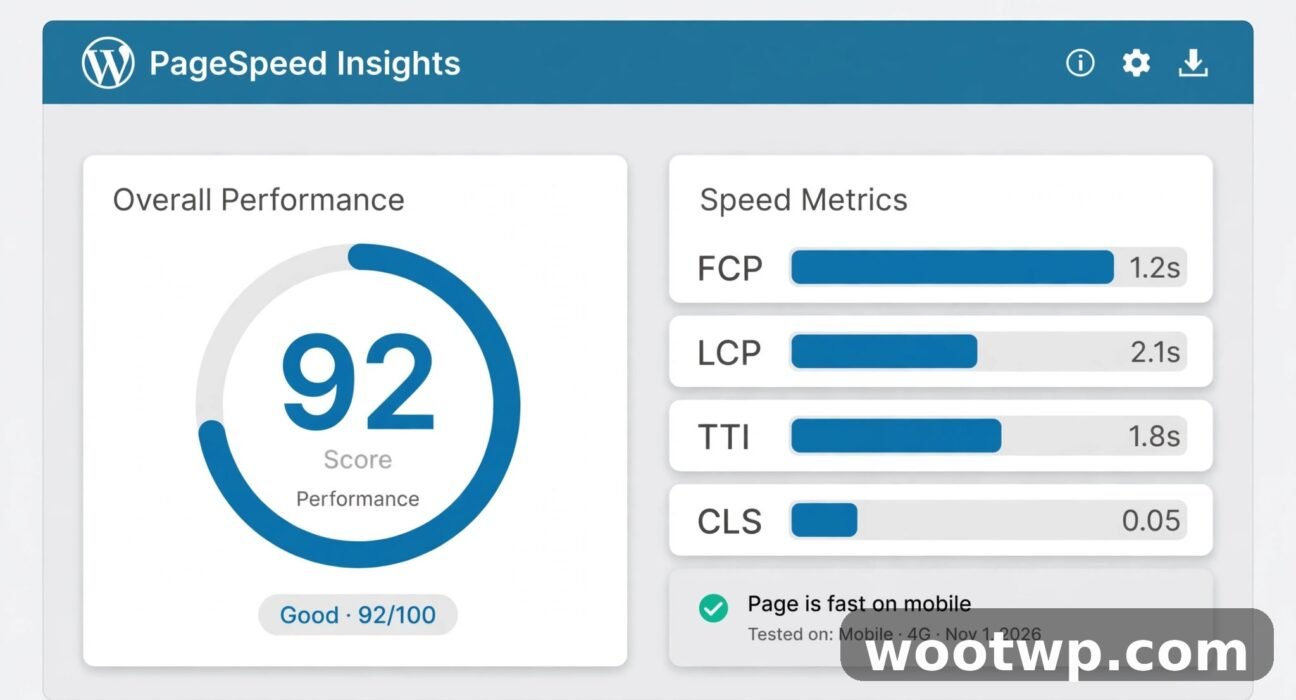
How to Check Website Speed With PageSpeed Insights: 7 Best Tips
Your site feels slow, visitors leave before the page loads, and you have no idea whether the server, the images, or a script is to blame. Learning how to check website speed with PageSpeed Insights gives you a free, concrete answer in under a minute. You enter a page address, Google tests it, and you get scores, real visitor data when it exists, and a ranked list of fixes with estimated time savings.
This guide shows how to check website speed with PageSpeed Insights step by step, how to read every part of the report without chasing a perfect score, and what to fix first. You will learn the difference between lab data and real visitor data, what the Core Web Vitals numbers actually mean, and how to retest fairly after each change so you know whether a fix helped or not.
Table of Contents
- What Is PageSpeed Insights and What Does It Measure?
- How to Check Website Speed With PageSpeed Insights in 5 Steps
- How to Read Your PageSpeed Insights Scores
- Core Web Vitals Explained: LCP, INP, and CLS
- How to Read the Opportunities and Diagnostics Lists
- How to Fix the Most Common PageSpeed Insights Problems
- How to Retest Fairly After Each Fix
- FAQs About Checking Website Speed With PageSpeed Insights
- Conclusion
What Is PageSpeed Insights and What Does It Measure?
PageSpeed Insights, often shortened to PSI, is Google’s free tool for testing how fast a single web page loads and how it feels to use. It runs at pagespeed.web.dev. You do not need to install anything, sign in, or own the site you test. Knowing how to check website speed with PageSpeed Insights means you can repeat this same test after every change and compare like with like. You can test your own page, a competitor’s page, or any public page, on mobile and on desktop, separately.
PageSpeed Insights reports two kinds of data, and confusing them is the most common mistake new users make:
- Field data, or real visitor data. This comes from the Chrome User Experience Report, known as CrUX, which collects anonymous data from real Chrome users over the last 28 days. It shows how actual visitors experienced the page. When you check website speed with PageSpeed Insights for a low-traffic page, this section may be missing or show origin-level data for the whole site instead of the single page. Field data changes slowly, because it reflects 28 days of visits, not today’s test.
- Lab data, or the Lighthouse test. This is a fresh, controlled test run by Google at the moment you click Analyze. It loads the page on a simulated mid-range phone, on a throttled connection, and measures what happens. Lab data changes at once when you fix something, but the score can move a few points from run to run, because Lighthouse runs on shared machines with simulated throttling.
PageSpeed Insights gives four scores from 0 to 100: Performance, Accessibility, Best Practices, and SEO. WP Rocket’s guide to reading your PageSpeed Insights report explains the same sections in detail, with examples of each score band. Performance is the speed score most people care about, and it is the one this guide focuses on. The other three matter too, but a page can score well on accessibility and SEO while still loading slowly, so read them separately.
In my experience, site owners waste the most time chasing a perfect 100 on Performance. Google’s own guidance, and the experience of most site owners, points the other way: pass the Core Web Vitals checks for real visitors, fix the biggest opportunity first, and accept that a feature-rich page may never hit 100. A fast-enough page that serves visitors well beats a stripped-down page that hits 100 but loses its purpose.
Mobile First, Then Desktop
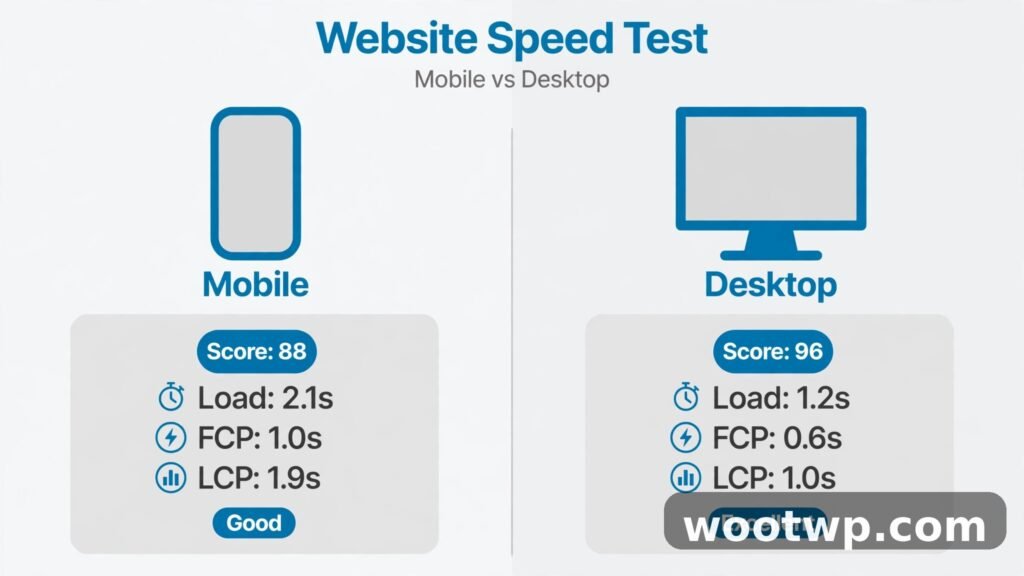
PageSpeed Insights defaults to a mobile test, and that is the right place to start. Google ranks and indexes the mobile version of most pages, and most visitors on many sites arrive on phones. Run the mobile test first, fix the biggest mobile problems, then switch to the desktop tab and check that view too. That order is why the steps below show how to check website speed with PageSpeed Insights on mobile first, then on desktop. A page that scores 90 on desktop and 45 on mobile still has a mobile problem, and mobile is where most of your visitors will feel it.
How to Check Website Speed With PageSpeed Insights in 5 Steps
Follow these steps exactly the first time, so you learn the report layout before you start fixing anything.
- Open a browser and go to PageSpeed Insights. This is the current home of PageSpeed Insights. The older developers.google.com address redirects here, but bookmark the current address.
- Paste the full page address into the Enter a web page URL field, including the https part, such as https://wootwp.com/. Test one specific page at a time, not just the homepage. A homepage, a long article, and a tool page can score very differently.
- Click Analyze. Wait 15 to 60 seconds while Google loads the page. Do not refresh the page or click away. A heavy page with many scripts can take longer than a minute.
- Read the mobile report first. Note the Performance score, the Core Web Vitals section, and the top three items in Opportunities, with their estimated savings in seconds.
- Click the Desktop tab at the top of the report and run the same check for desktop. Note where the two reports differ. Desktop almost always scores higher, because the test device is faster and the connection is not throttled as hard.
Save or screenshot the first report before you change anything. You need a baseline to compare against, and memory is a poor substitute. Write down the Performance score, the three Core Web Vitals values, and the top opportunity, with the date. After each fix, rerun the same test, on the same page, in the same mode, and compare like with like.
How to Test a Page That Needs a Login
PageSpeed Insights can only test public pages. It cannot sign in, pass a paywall, or test a page behind a login. If you need to test a logged-in page, use Lighthouse inside Chrome DevTools instead: open the page in Chrome while signed in, open DevTools, switch to the Lighthouse panel, choose Performance, and click Analyze page load. The report uses the same Lighthouse engine, and it tests the page as you see it. For public pages, stick with PageSpeed Insights, because it adds the real visitor data that a local Lighthouse run cannot show.
How to Read Your PageSpeed Insights Scores
Scores use three colour bands, and the band matters more than the exact number:
- 90 to 100, green. Good. The page performs well in the lab test. Keep monitoring, but do not rebuild a working page to chase a higher green number.
- 50 to 89, orange. Needs improvement. Fix the top opportunities in order, starting with the largest estimated saving.
- 0 to 49, red. Poor. The page likely feels slow to visitors. Work through the opportunities list from the top, and retest after each major fix.
When you check website speed with PageSpeed Insights, read the four category scores separately. Performance measures speed. Accessibility checks how easy the page is for all users, including people who use screen readers or keyboards. Best Practices checks for common web faults, such as outdated libraries or insecure requests. SEO checks basic search basics, such as a title, a meta description, and crawlable links. A low SEO score in PageSpeed Insights does not mean your search rankings will fall tomorrow, but the items it flags, such as missing titles or tiny tap targets, are worth fixing anyway.
Below the scores, the report shows a screenshot strip of the page as it loaded, and the metrics that built the Performance score. The screenshot strip helps you see when the page first showed content, and when it looked complete. If the strip stays blank for a long time, the page has a render-blocking problem: something stops the browser from showing content until it finishes loading. That is usually a script or a stylesheet in the page head, and the Opportunities list will name it.
Field Data Versus Lab Data in Your Report
When your page has enough traffic, the top of the report shows “Discover what your real users are experiencing”. This is field data from CrUX, over 28 days, at the 75th percentile of visitors. The 75th percentile means three quarters of visits were at least this fast, and one quarter was slower. Google judges Core Web Vitals at this percentile, so a page passes when the 75th percentile value meets the threshold.
Below that, the lab section shows “Diagnose performance issues”, with the fresh Lighthouse test. Lab metrics have names such as Largest Contentful Paint, Total Blocking Time, and Speed Index, and they describe this single test run. Use field data to judge how visitors actually experience the page, and lab data to find what to fix. If field data passes but the lab score is orange, the page is probably fine for most visitors, and the lab test ran under harsher conditions. If field data fails, fix the problem even if one lucky lab run scores green.
Core Web Vitals Explained: LCP, INP, and CLS
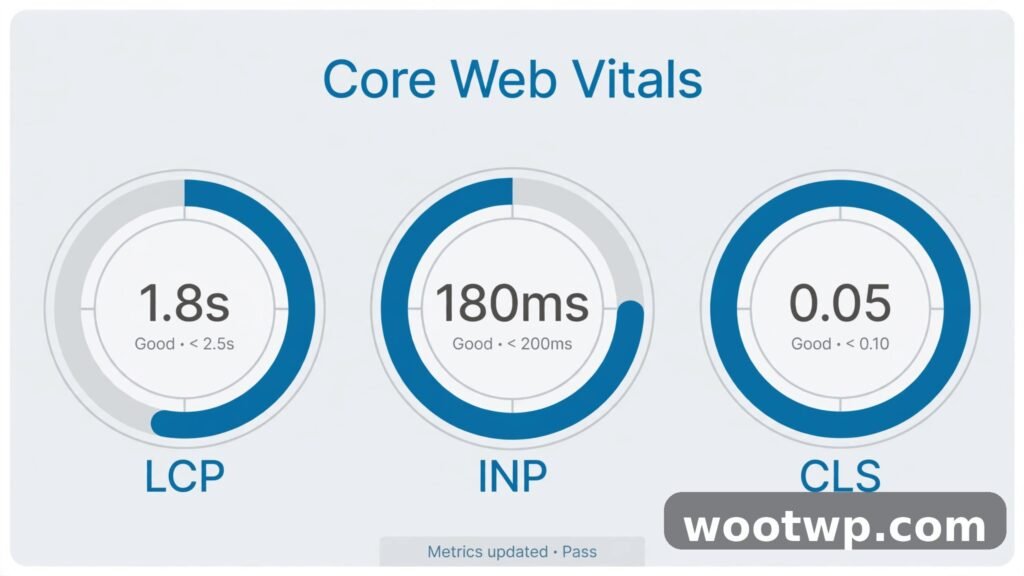
Core Web Vitals are the three metrics Google uses as part of its page experience signals. Each one measures a different part of how a page feels. Learn the thresholds, because they decide pass or fail, and they are simpler than the full Lighthouse report.
| Metric | What it measures | Good threshold |
|---|---|---|
| Largest Contentful Paint (LCP) | How long until the largest visible content, often a hero image or headline, appears | 2.5 seconds or less |
| Interaction to Next Paint (INP) | How quickly the page responds when a visitor clicks, taps, or types | 200 milliseconds or less |
| Cumulative Layout Shift (CLS) | How much the page layout jumps around while loading | 0.1 or less |
Largest Contentful Paint (LCP)
LCP measures loading speed from the visitor’s view. It records when the largest piece of content in the viewport finishes rendering. On many pages, that is a hero image, a large headline block, or a video poster. A slow server, a large uncompressed hero image, or a script that delays rendering all push LCP up.
To improve LCP, shrink and compress the hero image, serve it in a modern format such as WebP, preload it if your theme or plugin supports that, and cut render-blocking scripts from the page head. On WordPress, a caching plugin and image optimisation often move LCP the most for the least work. Learning how to compress images without losing quality is a practical first step, because oversized images are the most common LCP cause on content sites I have checked.
Interaction to Next Paint (INP)
INP measures responsiveness. It records the delay between a visitor’s interaction, such as a click or a tap, and the next visible update on screen. A page can load fast yet feel sluggish if heavy JavaScript blocks the main thread, which is the browser’s main work queue for running scripts and drawing the page. Long tasks, third-party scripts, and chat widgets are common INP causes.
To improve INP, cut or defer third-party scripts, break up long JavaScript tasks, and delay non-essential widgets until after the page loads. Test INP by clicking around the page yourself after it loads. If buttons feel dead for a beat, visitors feel it too, and the INP number will usually confirm it.
Cumulative Layout Shift (CLS)
CLS measures visual stability. It scores how much visible content moves after it first appears. A page that loads a headline, then jumps down when an ad, image, or font arrives, has layout shift. Visitors click the wrong link, lose their place while reading, and get annoyed, even if the page loads quickly in total.
To improve CLS, give images and embeds fixed width and height, or reserve space with aspect-ratio settings, so the browser holds their spot before they load. Load web fonts with a fallback that matches closely, and reserve space for ads and banners instead of letting them push content down when they arrive. CLS fixes are often cheap: a width and height on an image, or a reserved slot for a banner, can take a page from failing to passing.
How to Read the Opportunities and Diagnostics Lists
Below the metrics, PageSpeed Insights lists Opportunities, sorted by estimated saving in seconds, largest first. Each opportunity names a problem, shows the files or elements that cause it, and estimates how much time fixing it could save in the lab test. When you check website speed with PageSpeed Insights, work from the top down. The top item usually matters more than the next five combined.
Common opportunities and what they mean in plain words:
- Reduce unused JavaScript or CSS. The page loads code it never uses. A plugin, theme, or widget loads its full script on every page, even pages that do not need it. Defer, delay, or remove the code, or use a plugin that loads scripts only where needed.
- Serve images in next-gen formats. Images use JPEG or PNG where WebP or AVIF would be smaller. Convert images to WebP, and keep a fallback for old browsers if your setup needs one.
- Properly size images. An image file is far larger than the size shown on screen. Resize it to the display size, or serve a smaller version for phones.
- Eliminate render-blocking resources. A script or stylesheet in the page head stops the browser from showing content until it loads. Defer scripts, move them to the footer, or inline critical CSS for the top of the page.
- Reduce server response times. The server takes too long to send the first byte. This points at hosting, caching, or a slow database query, not at images. A caching plugin, a faster host, or a content delivery network helps here.
- Reduce the impact of third-party code. External scripts, such as ads, trackers, chat widgets, and social embeds, slow the page. The report names each third party and its cost. Remove the ones you do not need, and delay the rest.
The Diagnostics section below Opportunities lists deeper issues that do not carry a direct time saving, such as a large document object model, long main-thread tasks, or missing cache settings. Read Diagnostics after you fix Opportunities. Passed Audits, at the bottom, lists what already works. Skim it to confirm your fixes landed, and to avoid fixing what is already fine.
How to Open the Details of One Opportunity
Click any opportunity to expand it. The expanded view lists the exact files, their sizes, and the potential saving for each one. This is where a vague “your images are too big” turns into a specific file name and size you can act on. Note the file names before you open your site dashboard, so you fix the right file instead of guessing. If an opportunity names a file from a plugin you barely use, that plugin is a candidate for removal, not optimisation.
How to Fix the Most Common PageSpeed Insights Problems
Fix one problem at a time, retest, and note the result. Fixing five things at once and retesting tells you nothing about which change helped, and it makes rollback painful when a change breaks the layout.
Fix Slow Images First
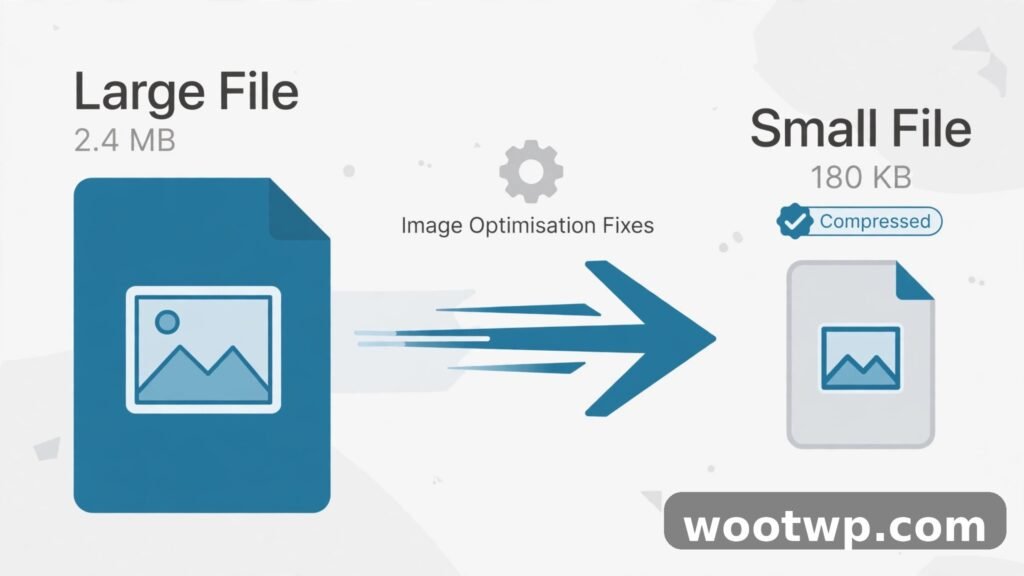
Images cause more speed problems on content sites than any other single factor, and they are the easiest to fix.
- Compress every image before upload, or use an image optimisation plugin that compresses on upload.
- Resize images to the largest size shown on screen. A 3000-pixel photo shown at 800 pixels wastes most of its file size.
- Serve WebP where your host and theme support it, with a fallback for older browsers.
- Add width and height to images, or set aspect ratios in your theme, to stop layout shift.
- Lazy-load images below the fold, so the browser loads the top of the page first. Most modern WordPress setups do this by default, but check that a plugin has not disabled it.
Fix Render-Blocking Scripts and Styles
- Open the render-blocking opportunity and note the named files.
- In your caching or optimisation plugin, turn on defer for JavaScript, and delay third-party scripts that are not needed for the first screen.
- Test the page visually after each change. Deferring the wrong script can break menus, sliders, or forms. If something breaks, undo that one change and try a gentler setting.
- For stylesheets, use the plugin’s critical CSS or “remove unused CSS” option if it offers one, and test on mobile and desktop before you keep it.
Fix a Slow Server Response
A slow server response shows up as “Reduce initial server response time” or a high Time to First Byte. Image fixes will not help it.
- Turn on page caching, so repeat visits serve a stored copy instead of rebuilding the page each time. On WordPress, a caching plugin handles this, and many hosts include caching at the server level.
- Check for a slow plugin or theme by testing with plugins disabled on a staging copy, never on the live site without a backup.
- Ask your host about server response times, or move to a host with faster storage and a nearby data centre if the server itself is the bottleneck. If your WordPress dashboard itself feels slow, read the guide on how to speed up the WordPress admin dashboard for dashboard-specific fixes that also help the front end.
Cut Third-Party Scripts
Third-party scripts are the hardest speed problem, because each one feels small on its own and large in total.
- List every third-party script in the report, with its cost in time.
- For each one, ask: does this script earn its keep on this page? An analytics script usually does. A chat widget on a page with no support offer often does not.
- Remove the scripts that fail that test, and delay the rest until after the first interaction or after the page loads.
- Retest. Third-party costs vary by the hour, as ad and tracker servers respond at different speeds, so test twice before you judge a single change.
How to Retest Fairly After Each Fix
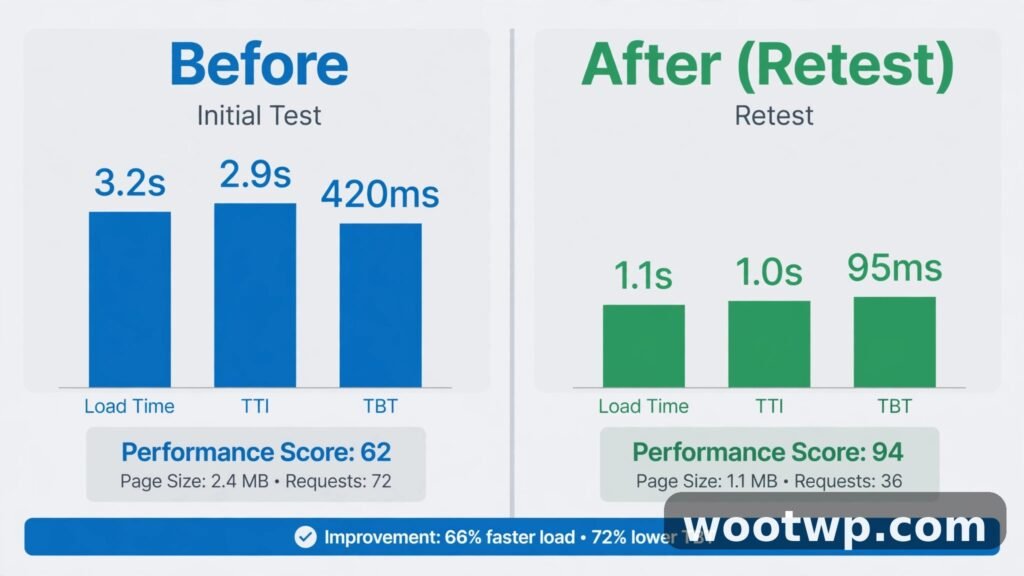
Learning how to check website speed with PageSpeed Insights fairly protects you from chasing noise, because scores move a few points from run to run even with no changes, as Lighthouse runs on shared machines under simulated throttling.
- Test the same URL, in the same mode. Mobile and desktop are different tests. Compare mobile with mobile, and desktop with desktop.
- Clear caches before retesting. Clear your site cache, your caching plugin cache, and any content delivery network cache, so the test loads the new version, not a stored old copy. On WordPress, clear the cache from the plugin toolbar, then wait a minute before you retest.
- Run the test twice. If the two scores differ by more than a few points, run a third time and take the middle value. A single run can be an outlier.
- Fix one thing, then retest. Note the score, the three Core Web Vitals values, and the top opportunity before and after each fix, in a simple note or spreadsheet.
- Wait for field data. Lab scores change at once, but field data reflects 28 days of real visits. Do not expect the real-visitor section to move the day after a fix. Give it weeks, and judge the fix by the lab data and by how the page feels in the meantime.
- Test at a quiet time. A busy server, a backup running, or a traffic spike can slow a test. If a score drops suddenly with no change from you, retest later before you undo good work.
In my experience, the disciplined retest habit matters more than any single optimisation trick. I have seen site owners undo a working fix because one noisy test run scored lower, and keep a harmful change because one lucky run scored higher. Two runs, the same URL, the same mode, and a written baseline, turn PageSpeed Insights from a source of anxiety into a useful measuring tool.
FAQs About Checking Website Speed With PageSpeed Insights
How do I check website speed with PageSpeed Insights for free?
To learn how to check website speed with PageSpeed Insights for free, go to pagespeed.web.dev, paste the full page address, including https, into the field, and click Analyze. The test is free, needs no sign-in, and returns mobile and desktop scores, Core Web Vitals, and a ranked list of fixes. Test one specific page at a time, and screenshot the first report as your baseline before you change anything.
What is a good PageSpeed Insights score?
A Performance score of 90 or above is good, 50 to 89 needs improvement, and below 50 is poor. Focus first on passing the Core Web Vitals thresholds for real visitors: Largest Contentful Paint at 2.5 seconds or less, Interaction to Next Paint at 200 milliseconds or less, and Cumulative Layout Shift at 0.1 or less, all at the 75th percentile. A green score with passing vitals matters more than a perfect 100.
Why does my PageSpeed Insights score change every time I test?
Lighthouse runs on shared machines with simulated throttling, so the score moves a few points from run to run even with no changes. Server load, third-party script speed, and network conditions also shift between runs. Test the same URL in the same mode twice, take the middle value if you run three times, and judge a fix by a clear trend, not by one run.
Can PageSpeed Insights test a page that needs a login?
No. PageSpeed Insights can only test public pages, and it cannot sign in or pass a paywall. To test a logged-in page, use Lighthouse in Chrome DevTools while signed in, on the page as you see it. For public pages, use PageSpeed Insights, because it adds real visitor data from the Chrome User Experience Report that a local test cannot show.
How do I check website speed with PageSpeed Insights on mobile versus desktop?
Run the mobile report first, from the default mobile tab, then click the Desktop tab for the desktop report. Mobile uses a simulated mid-range phone on a throttled connection, so it almost always scores lower. Fix mobile first, since Google indexes the mobile version and most visitors arrive on phones, then confirm desktop still performs well.
Does a low PageSpeed Insights score hurt my search rankings directly?
The score itself is not a direct ranking factor, but the underlying experience is. Core Web Vitals feed into Google’s page experience signals, and slow pages lose visitors who leave before content loads. Fix the largest opportunities, pass the Core Web Vitals thresholds for real visitors, and treat the lab score as a diagnostic tool, not as a ranking grade on its own.
Conclusion
To check website speed with PageSpeed Insights, test one public page at pagespeed.web.dev, read the mobile report first, and separate field data from lab data before you act. Each time you check website speed with PageSpeed Insights, fix the top opportunity, retest the same URL in the same mode twice, and note the result before you move to the next fix. Pass the Core Web Vitals thresholds for real visitors, keep the images small, the scripts deferred, and the layout stable, and let the score follow the experience, not the other way round.